

 NEWS
NEWS
NEWS
NEWS
NEWS
 I’ve been searching around today for what the data is saying about the London Riots. My sources: Twitter, Google and The Guardian DataBlog.
The Guardian blog used open data for its riot coverage. Its sources include The Metropolitam Police, the London Fire Brigade, the Association of Convenience Stores and the Twitter account: @Riotcleanup.
 Matt Stiles is a data journalist for National Public Radio. He created this interactive map with data from The Guardian and Google Fusion Tables.
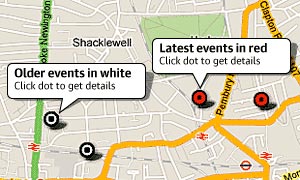
According to Stiles blog, The Daily Viz, the map shows recent riot locations in greater London as red points. Those red points represent what the Guardian calls indices of deprivation. This essentially means that these areas are more poverty-stricken. Deeper reds on the map represent higher poverty, while blues represent more income.
Here’s a larger view of the map. Stiles used both riot and deprivation data from The Guardian to create it. Crowdsourced riot data is something that has been done before during world events. In this case, The Guardian is using Google Docs that anyone can edit. Here are some of the most recent entries:

Services Angle
Recent world events have helped create a new data medium for making sense of the chaos that comes with riots and wars. We get the qualitative data in heavy doses but it’s the visualization that provides insights into how data services can be used to tell stories that words can not often convey.
… We’d like to tell you about our mission and how you can help us fulfill it. SiliconANGLE Media Inc.’s business model is based on the intrinsic value of the content, not advertising. Unlike many online publications, we don’t have a paywall or run banner advertising, because we want to keep our journalism open, without influence or the need to chase traffic.The journalism, reporting and commentary on SiliconANGLE — along with live, unscripted video from our Silicon Valley studio and globe-trotting video teams at theCUBE — take a lot of hard work, time and money. Keeping the quality high requires the support of sponsors who are aligned with our vision of ad-free journalism content.
If you like the reporting, video interviews and other ad-free content here, please take a moment to check out a sample of the video content supported by our sponsors, tweet your support, and keep coming back to SiliconANGLE.