


 Conventional wisdom rarely steers you astray, and in Visually‘s case, a picture really is worth a thousand words. The web service for sharing, creating and discovering visual infographics, is building on its success as a network for data nerds, launching the Marketplace we first caught wind of earlier this year.
Who doesn’t like to indulge in reading all kinds of data with visually appealing graphics, icons, and explanations, short and sweet, and to the point? Whether they are infographics, visualizations of information or data representation schemes – all depends on designers, statistics and the various schools of thought.
Now, the company is taking infographics to next level by introducing Visually Marketplace, a place for brands to create infographics, find the talent they need and to put its community of 45,000+ designers to work.
How does the Marketplace work for brands? Visual.ly explains, “Consumers will be able to come to the marketplace with their own data, or authenticate/login to their online data (ex Facebook) and the designers in the marketplace will build custom graphics based upon this data.
“Our platform is data agnostic. Our platform technology makes it very easy to convert user data to a data model used by the designer in creating the visualization. It’s a seamless process to the customer once they upload their data. Our goal is to make it easy for the designer and creators.”
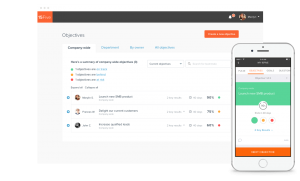
Interestingly, the marketplace isn’t just about infographics. Visually has created an algorithm to detect preferred style and desired layout based on consumers’ recommendation and a specialized project management dashboard that lets the graphics designers and clients share files and track progress. The program even creates a timeline of the project and sends alerts when due dates of the project are approaching. The project management feature also includes the ability to upload and approve projects, share opinions and track real-time project information.
“We wanted to create a platform that made it ridiculously easy for people to tell compelling stories with their data. That’s why the project management tool built into Marketplace incorporates the best practices we’ve learned along the way,” said Langille.
The service, currently in beta, supports only static infographics as of now. In the coming months, Visually plans to add support for interactive and motion graphics, access to third-party data feeds, and connections to additional creative resources like data analysts, researchers and journalists.
Whereas data visualization is a hot topic right now, Visual.ly free service for creating custom graphics allows users to quickly view data from Facebook and Twitter. They can choose from several skins and convert data from the social web graphics, or viewing interactions on Facebook.
The company wants to promote and encourage the design community to connect with brands and publishers. The startup was quick to build a set of tools around data visualization, launching DIY infographics at SXSW this year. They also launched new social features, expanding tool sets around design promotion to include an activity feed, options for direct messaging around a project, and notifications sent via email for comments, project availability and updates on social networks.
And according to company data, the average consumer responds to visual content better than text. Great visual content results in 30x the sharing compared to a similar text article.
“Data by itself provides insights to consumers. The challenge is how to visualize that data so they can easily digest, and communicate that data to their co-workers, readers, and friends. This is what makes data powerful,” the company says.
The data then can be used to educate consumers on topics and industries related to the brand, which will help to create a strong brand engagement. This will drive the user to share the content, lead gen and engagement for brands.
… We’d like to tell you about our mission and how you can help us fulfill it. SiliconANGLE Media Inc.’s business model is based on the intrinsic value of the content, not advertising. Unlike many online publications, we don’t have a paywall or run banner advertising, because we want to keep our journalism open, without influence or the need to chase traffic.The journalism, reporting and commentary on SiliconANGLE — along with live, unscripted video from our Silicon Valley studio and globe-trotting video teams at theCUBE — take a lot of hard work, time and money. Keeping the quality high requires the support of sponsors who are aligned with our vision of ad-free journalism content.
If you like the reporting, video interviews and other ad-free content here, please take a moment to check out a sample of the video content supported by our sponsors, tweet your support, and keep coming back to SiliconANGLE.