

 NEWS
NEWS
NEWS
NEWS
NEWS
In a rollout billed as a “partial re-positioning of the company,” analytics maker GoodData Corp. today rolled out an analytics distribution platform that makes it possible for data owners to distribute information from their own warehouses on a personalized basis to individuals, channel affiliates and other constituents.
The initiative is based on the assumption that analytics are most useful when customized to the needs of the user. The GoodData platform makes it possible for businesses to churn through aggregated data that they own and deliver customized cuts to constituents in a dashboard format.
“To the provider it looks like a one-to-many deployment, but to the consumer it looks like a one-to-one relationship,” said Jeff Morris, vice president of product marketing at GoodData. “Engagement improves when you give the customer the ability to modify and create a personal analytic experience.”
For example, a restaurant franchisee may want to see the performance of his store but also that of other stores in the area in order to benchmark progress. GoodData used the example of ServiceChannel, an ERP system for multi-tenant management in facilities like shopping malls. By integrating the GoodData platform with data collected by ServiceChannel, “The Apple store can log in and see what’s going on across multiple stores in the same mall to find patterns that can show engagement opportunities,” Morris said. GoodData is initially positioning the platform as a business-to-business tool for companies with multiple sales and service partners.
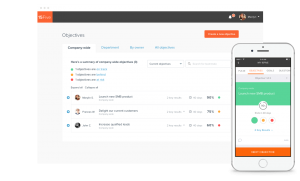
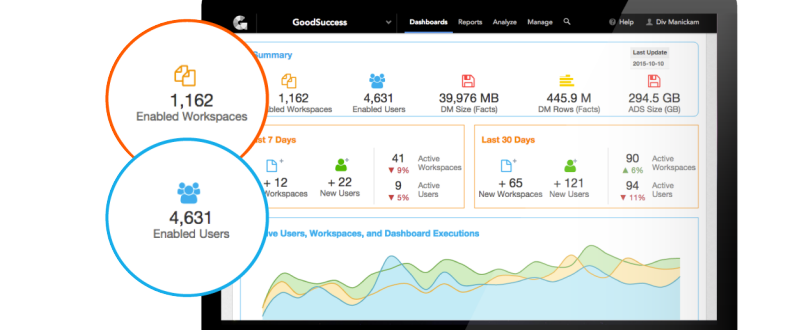
The platform encompasses extract/transform/load (ETL) technology for retrieving data from multiple back ends and a data warehousing and analytic engine that creates what the company calls “workspaces.” These provide a set of customizable pre-packaged analytics and user experience metaphors. Typically, data is exposed in a dashboard format so that users can drill down to see detailed analytics that are of interest to them.
Data owners can selectively expose data from multiple constituents for comparison purposes. For example, the Apple Store owner could see which cleaning services are providing the best performance for other tenants. User can also blend local data with that distributed from the central source and share findings to their networks.
Installation involves some front-end configuration work that typically takes between 12 and 16 weeks, Morris said. “Then we capture customer feedback to continually build out analytics functionality.” Licensing is determined by the number of downstream users.
… We’d like to tell you about our mission and how you can help us fulfill it. SiliconANGLE Media Inc.’s business model is based on the intrinsic value of the content, not advertising. Unlike many online publications, we don’t have a paywall or run banner advertising, because we want to keep our journalism open, without influence or the need to chase traffic.The journalism, reporting and commentary on SiliconANGLE — along with live, unscripted video from our Silicon Valley studio and globe-trotting video teams at theCUBE — take a lot of hard work, time and money. Keeping the quality high requires the support of sponsors who are aligned with our vision of ad-free journalism content.
If you like the reporting, video interviews and other ad-free content here, please take a moment to check out a sample of the video content supported by our sponsors, tweet your support, and keep coming back to SiliconANGLE.