

 BIG DATA
BIG DATA
BIG DATA
BIG DATA
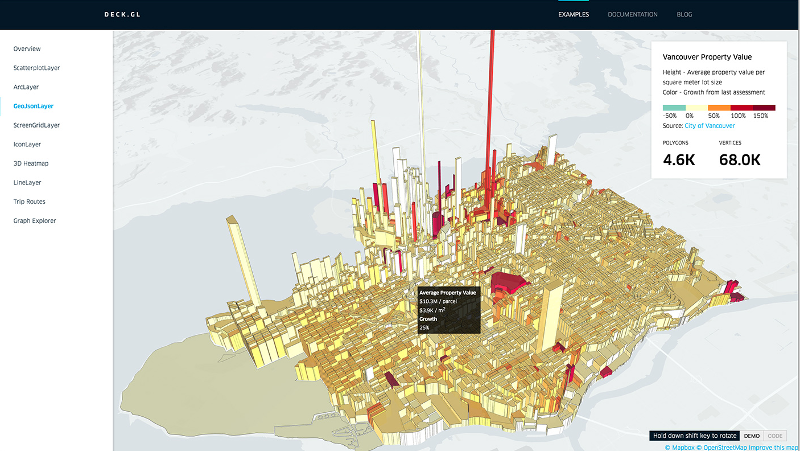
Like other top tech companies, Uber Technologies Inc. often creates custom software tools for its staff when the products available on the market don’t fully fit the bill. One of the ride-hailing giant’s most notable projects is a data visualization tool called deck.lg that became accessible to the public last year and has received a major update today.
Nicolas Garcia Belmonte, the head of the team behind the system, detailed the changes in a post on the Uber Engineering blog. The biggest improvement is that the core visualization features in deck.lg 4.0 are decoupled from the default interface, which was created to help the company’s employees examine location data related to its service. The result is that the tool can now support a variety other use cases besides analyzing driving patterns, traffic congestion and other information that needs to be imposed on a map.
According to Garcia Belmonte, Uber has already put the new version to the test by harnessing deck.lg to visualize its internal machine learning projects. Artificial intelligence is so complex that fully understanding how an algorithm interprets images or associates different words can be almost impossible without a graphical representation. For this reason, Google Inc. recently open-sourced a modeling tool specifically designed to help development teams gain better visibility into their AI projects.
Another area where Uber has applied deck.lg 4.0 is network diagnostics. Similarly to machine learning applications, data center infrastructure generates a tremendous amount of information that can be difficult to understand in its raw form.
The augmented visualization capabilities in the new release are joined by a revamped documentation library that aims to ease the learning process. When a user is testing out one of the sample graphs that Uber has included in deck.lg, they can now pull up the relevant explainer using a simple mouse drag. The tool currently features 10 examples that include visualizations of car and vehicle traffic in major metropolitan areas well as more abstract models designed to provide a foundation for new projects.
The code for deck.lg is available on Uber’s GitHub page.
… We’d like to tell you about our mission and how you can help us fulfill it. SiliconANGLE Media Inc.’s business model is based on the intrinsic value of the content, not advertising. Unlike many online publications, we don’t have a paywall or run banner advertising, because we want to keep our journalism open, without influence or the need to chase traffic.The journalism, reporting and commentary on SiliconANGLE — along with live, unscripted video from our Silicon Valley studio and globe-trotting video teams at theCUBE — take a lot of hard work, time and money. Keeping the quality high requires the support of sponsors who are aligned with our vision of ad-free journalism content.
If you like the reporting, video interviews and other ad-free content here, please take a moment to check out a sample of the video content supported by our sponsors, tweet your support, and keep coming back to SiliconANGLE.