

 BIG DATA
BIG DATA
BIG DATA
BIG DATA
Tableau Software Inc. said today it has managed to jack up the speed at which enterprises can visualize important data for decision-makers.
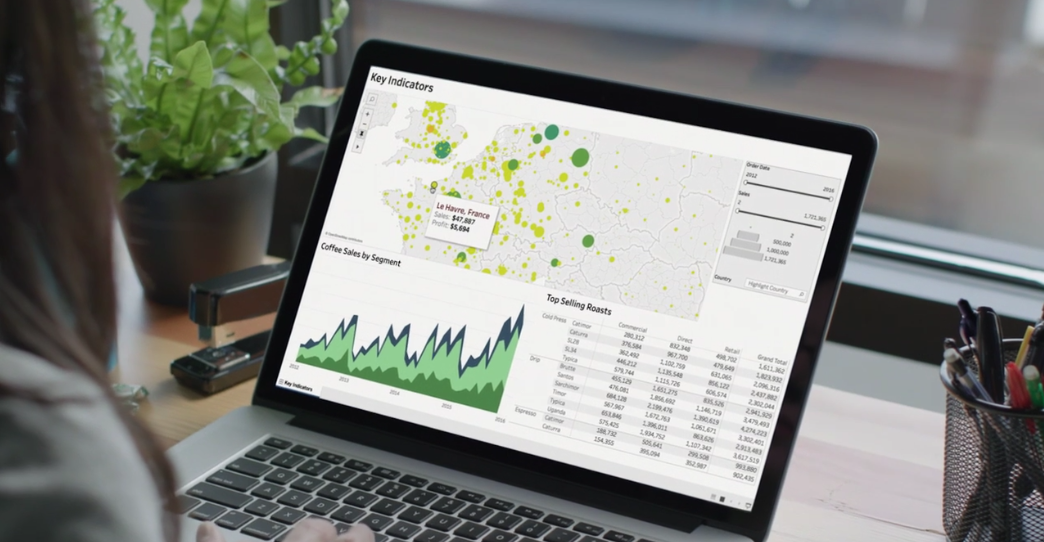
This morning the company launched a new release of its namesake business intelligence platform that processes information as much as five times faster than the previous release. The performance gains can potentially be even bigger for some specific operations. Speaking to ZDNet, Tableau Chief Executive Adam Selipsky said that extracting a million rows of data from an external source now takes 10 seconds compared with five minutes before.
The credit for the speed boost goes to the new analytics engine that can be found in Tableau 10.5. Dubbed Hyper, the database was originally developed by a German startup of the same name that the data visualization giant acquired in 2016. The system keeps records in memory during analysis to avoid the delay of fetching them from storage and can ingest new information at the same time.
In practice, this means that users will have to spend much less time waiting for their queries to be executed. Tableau said Hyper also makes it easier to work with big data sets that until now had to be split up because of processing time constraints.
The engine is rolling out alongside Viz in Toolkit, a new front-end feature likewise intended to make large volumes of information more digestible. The capability enables analysts to place data that otherwise might not fit into dashboard in pop-ups that appear when a user hovers the mouse over certain sections of a visualization.
One area where Viz in Tooltips might come handy is geospatial analysis. A graph visualizing a company’s domestic sales, for example, could be augmented to show a month-by-month revenue breakdown for the state on which the viewer places their cursor. The feature can thus remove the need for users to open a separate chart in a new tab while not overcrowding the original dashboard.
Rounding out the update is the addition of Linux support to Tableau Service. The product, which is offered separately from Tableau’s data visualization tool, provides a portal where an analyst can publish graphs and data sources for colleagues to access.
… We’d like to tell you about our mission and how you can help us fulfill it. SiliconANGLE Media Inc.’s business model is based on the intrinsic value of the content, not advertising. Unlike many online publications, we don’t have a paywall or run banner advertising, because we want to keep our journalism open, without influence or the need to chase traffic.The journalism, reporting and commentary on SiliconANGLE — along with live, unscripted video from our Silicon Valley studio and globe-trotting video teams at theCUBE — take a lot of hard work, time and money. Keeping the quality high requires the support of sponsors who are aligned with our vision of ad-free journalism content.
If you like the reporting, video interviews and other ad-free content here, please take a moment to check out a sample of the video content supported by our sponsors, tweet your support, and keep coming back to SiliconANGLE.