

 BIG DATA
BIG DATA
BIG DATA
BIG DATA
Business intelligence heavyweight Tableau Software Inc. today bolstered its product lineup with a new visual tool for turning raw information into a form that lends itself to analysis.
The appropriately named Data Prep focuses on easing the labor-intensive preparatory steps that analysts must perform before they can begin to search for insights in their records. Research has shown that data scientists spend as much as 80 percent of their time on this part of the workflow.
As a result, any tool that streamlines the process can potentially significantly speed up a company’s analytics projects. Tableau is counting on this dynamic to generate demand for Data Prep among the organizations that rely on its data visualization software.
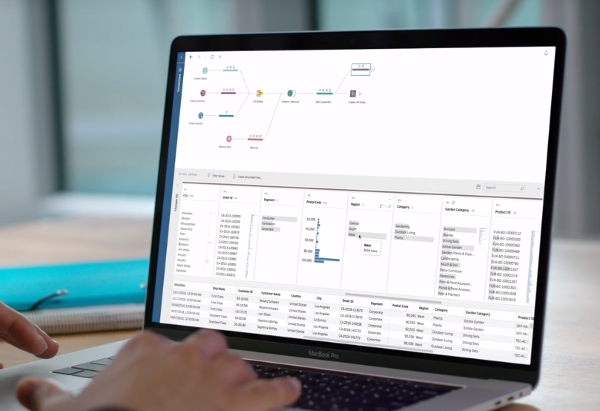
One of the product’s most distinguishing features is its three-part user interface. One panel displays a high-level diagram of the user’s data preparation workflow, while another contains key details about the information being processed. The third and most granular section, on the bottom, allows analysts to view the individual data points.
Tableau says that Data Prep calculates the changes caused by a user’s action in real time even if the dataset they’re working with contains millions of rows. The result is that analysts can quickly try out different approaches without a significant delay between operations, a major convenience in large projects.
Also in the interest of saving time, Tableau included a feature it calls fuzzy clustering. The company says that the capability enables users to carry out certain repetitive tasks with a single click.
Data Prep is available in the Creator version of Tableau’s visualization platform, one of three new product editions that the company introduced today. It’s designed for analysts who require the platform’s most advanced features, while the other two cater to less technical users. Pricing ranges from $70 per seat per month for Creator to $12 per seat per month for the cheapest Viewer edition, which is geared toward workers who mostly use dashboards created by others.
… We’d like to tell you about our mission and how you can help us fulfill it. SiliconANGLE Media Inc.’s business model is based on the intrinsic value of the content, not advertising. Unlike many online publications, we don’t have a paywall or run banner advertising, because we want to keep our journalism open, without influence or the need to chase traffic.The journalism, reporting and commentary on SiliconANGLE — along with live, unscripted video from our Silicon Valley studio and globe-trotting video teams at theCUBE — take a lot of hard work, time and money. Keeping the quality high requires the support of sponsors who are aligned with our vision of ad-free journalism content.
If you like the reporting, video interviews and other ad-free content here, please take a moment to check out a sample of the video content supported by our sponsors, tweet your support, and keep coming back to SiliconANGLE.